Interesting info regarding poster printing quantities

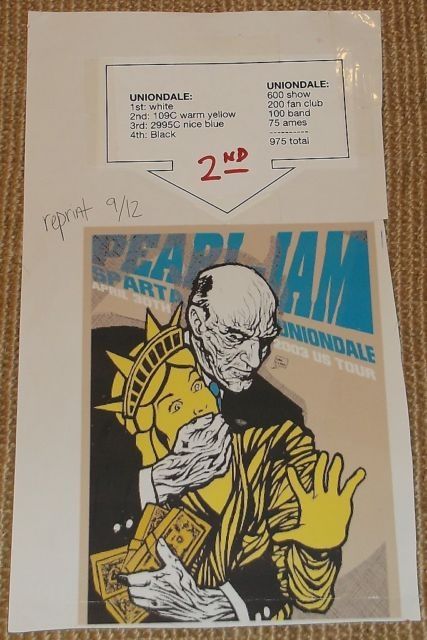
I found this photo on ebay while searching for posters. It's the color chart for the printer, which I've seen before for other shows, but the interesting thing is it shows how many posters were printed and how they were distributed:
Show - 600
Fan club - 200
Band - 100
Ames - 75
Show - 600
Fan club - 200
Band - 100
Ames - 75
1996: Randall's Island 2 1998: East Rutherford | MSG 1 & 2 2000: Cincinnati | Columbus | Jones Beach 1, 2, & 3 | Boston 1 | Camden 1 & 2 2003: Philadelphia | Uniondale | MSG 1 & 2 | Holmdel 2005: Atlantic City 1 2006: Camden 1 | East Rutherford 1 & 2 2008: Camden 1 & 2 | MSG 1 & 2 | Newark (EV) 2009: Philadelphia 1, 2 & 4 2010: Newark | MSG 1 & 2 2011: Toronto 1 2013: Wrigley Field | Brooklyn 2 | Philadelphia 1 & 2 | Baltimore 2015: Central Park 2016: Philadelphia 1 & 2 | MSG 1 & 2 | Fenway Park 2 | MSG (TOTD) 2017: Brooklyn (RnR HOF) 2020: MSG | Asbury Park 2021: Asbury Park 2022: MSG | Camden | Nashville 2024: MSG 1 & 2 (#50) | Philadelphia 1 & 2 | Baltimore 2025: Raleigh
0
Comments
"AP1 #/100: Signed and numbered out of 100 by the artists. AP2 #/50: Signed and numbered out of 50 by the artists. AP2 posters are not reprints but instead additional 1st run prints returned to the artist, then signed, numbered and sold."
So, no second printing.
Not like in 98/2000 where most shows had 200 to 300 printed.