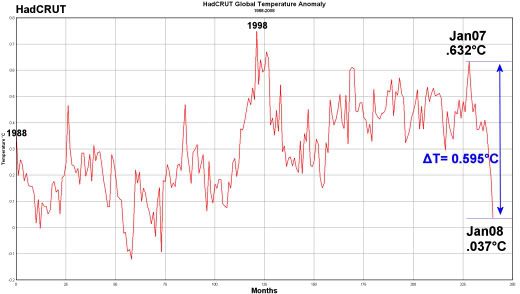
12 month long drop in temps wipe out a century of warming

Flutter Girl
Posts: 548
Over the past year, anecdotal evidence for a cooling planet has exploded. China has its coldest winter in 100 years. Baghdad sees its first snow in all recorded history. North America has the most snowcover in 50 years, with places like Wisconsin the highest since record-keeping began. Record levels of Antarctic sea ice, record cold in Minnesota, Texas, Florida, Mexico, Australia, Iran, Greece, South Africa, Greenland, Argentina, Chile -- the list goes on and on.
No more than anecdotal evidence, to be sure. But now, that evidence has been supplanted by hard scientific fact. All four major global temperature tracking outlets (Hadley, NASA's GISS, UAH, RSS) have released updated data. All show that over the past year, global temperatures have dropped precipitously.
A compiled list of all the sources can be seen here-
http://wattsupwiththat.com/2008/02/19/january-2008-4-sources-say-globally-cooler-in-the-past-12-months/
The total amount of cooling ranges from 0.65C up to 0.75C -- a value large enough to wipe out most of the warming recorded over the past 100 years. All in one year's time. For all four sources, it's the single fastest temperature change ever recorded, either up or down.
Also, there was an update posted with this article: The graph for HadCRUT (above), as well as the linked graphs for RSS and UAH are generated month-to-month; the temperature declines span a full 12 months of data. The linked GISS graph was graphed for the month of January only, due to a limitation in the plotting program.
Here is an article related to the one above-
http://www.dailytech.com/Solar+Activity+Diminishes+Researchers+Predict+Another+Ice+Age/article10630.htm
some more figures-
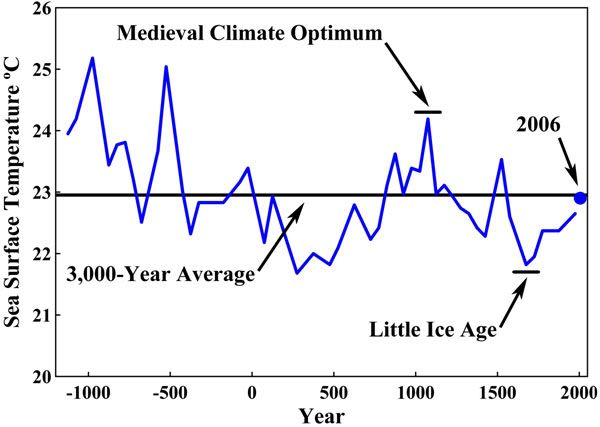
Figure 1: Surface temperatures in the Sargasso Sea, a 2 million square mile region of the Atlantic Ocean, with time resolution of 50 to 100 years and ending in 1975, as determined by isotope ratios of marine organism remains in sediment at the bottom of the sea (3). The horizontal line is the average temperature for this 3,000-year period. The Little Ice Age and Medieval Climate Optimum were naturally occurring, extended intervals of climate departures from the mean. A value of 0.25 °C, which is the change in Sargasso Sea temperature between 1975 and 2006, has been added to the 1975 data in order to provide a 2006 temperature value.
The average temperature of the Earth has varied within a range of about 3°C during the past 3,000 years. It is currently increasing as the Earth recovers from a period that is known as the Little Ice Age, as shown in Figure 1. George Washington and his army were at Valley Forge during the coldest era in 1,500 years, but even then the temperature was only about 1° Centigrade below the 3,000-year average.
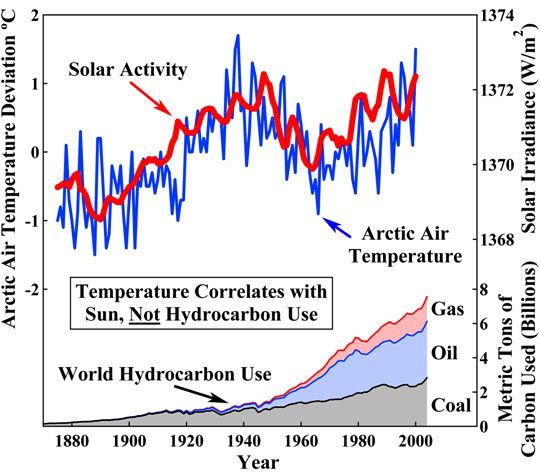
Figure 3: Arctic surface air temperature compared with total solar irradiance as measured by sunspot cycle amplitude, sunspot cycle length, solar equatorial rotation rate, fraction of penumbral spots, and decay rate of the 11-year sunspot cycle (8,9). Solar irradiance correlates well with Arctic temperature, while hydrocarbon use (7) does not correlate.
Atmospheric temperature is regulated by the sun, which fluctuates in activity as shown in Figure 3; by the greenhouse effect, largely caused by atmospheric water vapor (H2O); and by other phenomena that are more poorly understood. While major greenhouse gas H2O substantially warms the Earth, minor greenhouse gases such as CO2 have little effect, as shown in Figures 2 and 3. The 6-fold increase in hydrocarbon use since 1940 has had no noticeable effect on atmospheric temperature or on the trend in glacier length.
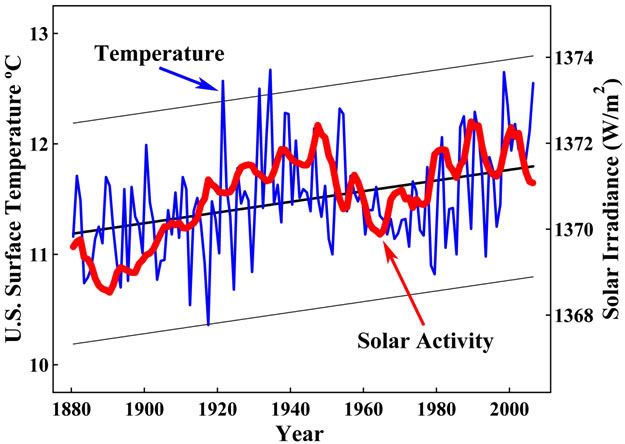
Figure 5: U.S. surface temperature from Figure 4 as compared with total solar irradiance (19) from Figure 3.
Between 1900 and 2000, on absolute scales of solar irradiance and degrees Kelvin, solar activity increased 0.19%, while a 0.5 °C temperature change is 0.21%. This is in good agreement with estimates that Earth's temperature would be reduced by 0.6 °C through particulate blocking of the sun by 0.2% (18).
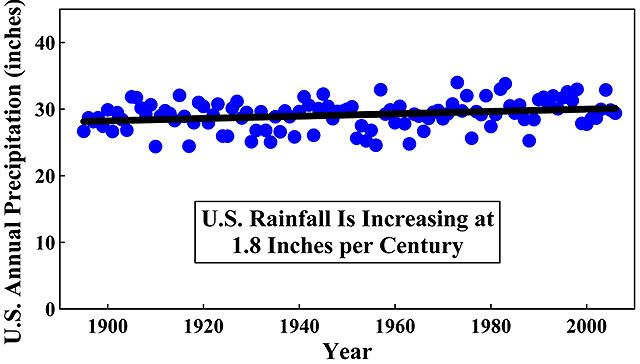
Figure 7: Annual precipitation in the contiguous 48 United States between 1895 and 2006. U.S. National Climatic Data Center, U.S. Department of Commerce 2006 Climate Review (20). The trend shows an increase in rainfall of 1.8 inches per century – approximately 6% per century.
During the current period of recovery from the Little Ice Age, the U.S. climate has improved somewhat, with more rainfall, fewer tornados, and no increase in hurricane activity, as illustrated in Figures 7 to 10. Sea level has trended upward for the past 150 years at a rate of 7 inches per century, with 3 intermediate uptrends and 2 periods of no increase as shown in Figure 11. These features are confirmed by the glacier record as shown in Figure 12. If this trend continues as did that prior to the Medieval Climate Optimum, sea level would be expected to rise about 1 foot during the next 200 years.
As shown in Figures 2, 11, and 12, the trends in glacier shortening and sea level rise began a century before the 60-year 6-fold increase in hydrocarbon use, and have not changed during that increase. Hydrocarbon use could not have caused these trends.
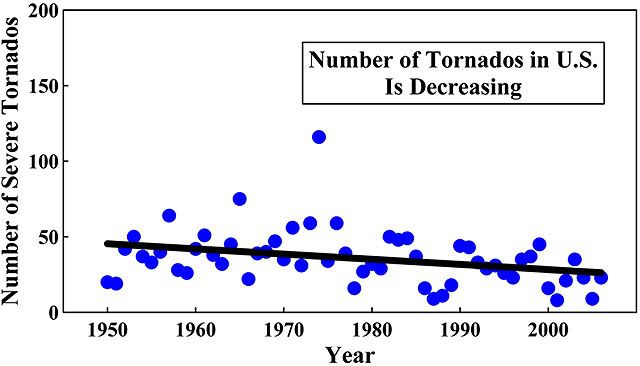
Figure 8: Annual number of strong-to-violent category F3 to F5 tornados during the March-to-August tornado season in the U.S. between 1950 and 2006. U.S. National Climatic Data Center, U.S. Department of Commerce 2006 Climate Review (20). During this period, world hydrocarbon use increased 6-fold, while violent tornado frequency decreased by 43%.
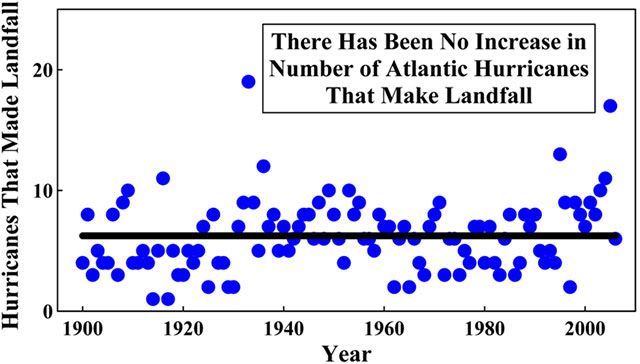
Figure 9: Annual number of Atlantic hurricanes that made landfall between 1900 and 2006 (21). Line is drawn at mean value.
Does a catastrophic amplification of these trends with damaging climatological consequences lie ahead? There are no experimental data that suggest this. There is also no experimentally validated theoretical evidence of such an amplification.
Predictions of catastrophic global warming are based on computer climate modeling, a branch of science still in its infancy. The empirical evidence – actual measurements of Earth's temperature and climate – shows no man-made warming trend. Indeed, during four of the seven decades since 1940 when average CO2 levels steadily increased, U.S. average temperatures were actually decreasing. While CO2 levels have increased substantially and are expected to continue doing so.
There is, however, one very dangerous possibility.
Our industrial and technological civilization depends upon abundant, low-cost energy. This civilization has already brought unprecedented prosperity to the people of the more developed nations. Billions of people in the less developed nations are now lifting themselves from poverty by adopting this technology.
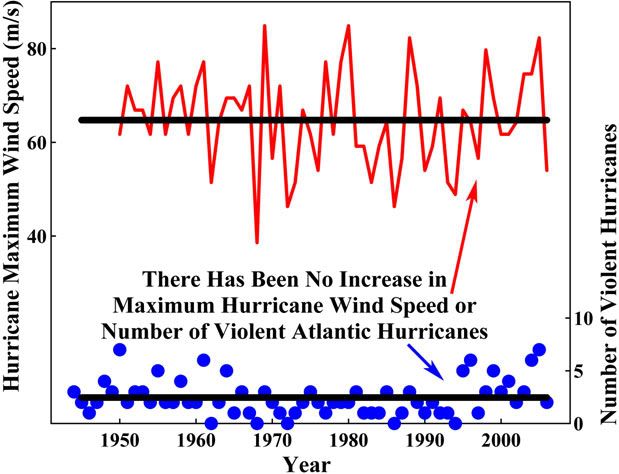
Figure 10: Annual number of violent hurricanes and maximum attained wind speed during those hurricanes in the Atlantic Ocean between 1944 and 2006 (22,23). There is no upward trend in either of these records. During this period, world hydrocarbon use increased 6-fold. Lines are mean values.
Hydrocarbons are essential sources of energy to sustain and extend prosperity. This is especially true of the developing nations, where available capital and technology are insufficient to meet rapidly increasing energy needs without extensive use of hydrocarbon fuels. If, through misunderstanding of the underlying science and through misguided public fear and hysteria, mankind significantly rations and restricts the use of hydrocarbons, the worldwide increase in prosperity will stop. The result would be vast human suffering and the loss of hundreds of millions of human lives. Moreover, the prosperity of those in the developed countries would be greatly reduced.
No more than anecdotal evidence, to be sure. But now, that evidence has been supplanted by hard scientific fact. All four major global temperature tracking outlets (Hadley, NASA's GISS, UAH, RSS) have released updated data. All show that over the past year, global temperatures have dropped precipitously.
A compiled list of all the sources can be seen here-
http://wattsupwiththat.com/2008/02/19/january-2008-4-sources-say-globally-cooler-in-the-past-12-months/
The total amount of cooling ranges from 0.65C up to 0.75C -- a value large enough to wipe out most of the warming recorded over the past 100 years. All in one year's time. For all four sources, it's the single fastest temperature change ever recorded, either up or down.
Also, there was an update posted with this article: The graph for HadCRUT (above), as well as the linked graphs for RSS and UAH are generated month-to-month; the temperature declines span a full 12 months of data. The linked GISS graph was graphed for the month of January only, due to a limitation in the plotting program.
Here is an article related to the one above-
http://www.dailytech.com/Solar+Activity+Diminishes+Researchers+Predict+Another+Ice+Age/article10630.htm
some more figures-
Figure 1: Surface temperatures in the Sargasso Sea, a 2 million square mile region of the Atlantic Ocean, with time resolution of 50 to 100 years and ending in 1975, as determined by isotope ratios of marine organism remains in sediment at the bottom of the sea (3). The horizontal line is the average temperature for this 3,000-year period. The Little Ice Age and Medieval Climate Optimum were naturally occurring, extended intervals of climate departures from the mean. A value of 0.25 °C, which is the change in Sargasso Sea temperature between 1975 and 2006, has been added to the 1975 data in order to provide a 2006 temperature value.
The average temperature of the Earth has varied within a range of about 3°C during the past 3,000 years. It is currently increasing as the Earth recovers from a period that is known as the Little Ice Age, as shown in Figure 1. George Washington and his army were at Valley Forge during the coldest era in 1,500 years, but even then the temperature was only about 1° Centigrade below the 3,000-year average.
Figure 3: Arctic surface air temperature compared with total solar irradiance as measured by sunspot cycle amplitude, sunspot cycle length, solar equatorial rotation rate, fraction of penumbral spots, and decay rate of the 11-year sunspot cycle (8,9). Solar irradiance correlates well with Arctic temperature, while hydrocarbon use (7) does not correlate.
Atmospheric temperature is regulated by the sun, which fluctuates in activity as shown in Figure 3; by the greenhouse effect, largely caused by atmospheric water vapor (H2O); and by other phenomena that are more poorly understood. While major greenhouse gas H2O substantially warms the Earth, minor greenhouse gases such as CO2 have little effect, as shown in Figures 2 and 3. The 6-fold increase in hydrocarbon use since 1940 has had no noticeable effect on atmospheric temperature or on the trend in glacier length.
Figure 5: U.S. surface temperature from Figure 4 as compared with total solar irradiance (19) from Figure 3.
Between 1900 and 2000, on absolute scales of solar irradiance and degrees Kelvin, solar activity increased 0.19%, while a 0.5 °C temperature change is 0.21%. This is in good agreement with estimates that Earth's temperature would be reduced by 0.6 °C through particulate blocking of the sun by 0.2% (18).
Figure 7: Annual precipitation in the contiguous 48 United States between 1895 and 2006. U.S. National Climatic Data Center, U.S. Department of Commerce 2006 Climate Review (20). The trend shows an increase in rainfall of 1.8 inches per century – approximately 6% per century.
During the current period of recovery from the Little Ice Age, the U.S. climate has improved somewhat, with more rainfall, fewer tornados, and no increase in hurricane activity, as illustrated in Figures 7 to 10. Sea level has trended upward for the past 150 years at a rate of 7 inches per century, with 3 intermediate uptrends and 2 periods of no increase as shown in Figure 11. These features are confirmed by the glacier record as shown in Figure 12. If this trend continues as did that prior to the Medieval Climate Optimum, sea level would be expected to rise about 1 foot during the next 200 years.
As shown in Figures 2, 11, and 12, the trends in glacier shortening and sea level rise began a century before the 60-year 6-fold increase in hydrocarbon use, and have not changed during that increase. Hydrocarbon use could not have caused these trends.
Figure 8: Annual number of strong-to-violent category F3 to F5 tornados during the March-to-August tornado season in the U.S. between 1950 and 2006. U.S. National Climatic Data Center, U.S. Department of Commerce 2006 Climate Review (20). During this period, world hydrocarbon use increased 6-fold, while violent tornado frequency decreased by 43%.
Figure 9: Annual number of Atlantic hurricanes that made landfall between 1900 and 2006 (21). Line is drawn at mean value.
Does a catastrophic amplification of these trends with damaging climatological consequences lie ahead? There are no experimental data that suggest this. There is also no experimentally validated theoretical evidence of such an amplification.
Predictions of catastrophic global warming are based on computer climate modeling, a branch of science still in its infancy. The empirical evidence – actual measurements of Earth's temperature and climate – shows no man-made warming trend. Indeed, during four of the seven decades since 1940 when average CO2 levels steadily increased, U.S. average temperatures were actually decreasing. While CO2 levels have increased substantially and are expected to continue doing so.
There is, however, one very dangerous possibility.
Our industrial and technological civilization depends upon abundant, low-cost energy. This civilization has already brought unprecedented prosperity to the people of the more developed nations. Billions of people in the less developed nations are now lifting themselves from poverty by adopting this technology.
Figure 10: Annual number of violent hurricanes and maximum attained wind speed during those hurricanes in the Atlantic Ocean between 1944 and 2006 (22,23). There is no upward trend in either of these records. During this period, world hydrocarbon use increased 6-fold. Lines are mean values.
Hydrocarbons are essential sources of energy to sustain and extend prosperity. This is especially true of the developing nations, where available capital and technology are insufficient to meet rapidly increasing energy needs without extensive use of hydrocarbon fuels. If, through misunderstanding of the underlying science and through misguided public fear and hysteria, mankind significantly rations and restricts the use of hydrocarbons, the worldwide increase in prosperity will stop. The result would be vast human suffering and the loss of hundreds of millions of human lives. Moreover, the prosperity of those in the developed countries would be greatly reduced.
Post edited by Unknown User on
0
Comments
-
yes global climate change is real, humans need to stop fucking up our planet.0
-
re-read it..obviously you missed every portion where it says humans cannot be responsible for the changes. They clearly show the sun is responsible for it.
I really hate cherry pickers...you do realise how idiotic you come off to anyone who actually bothers to read it, don't you?
I've said before climate change is real. It's been real since the day the earth began to spin. Oh but I suppose we are somehow resposible for all the climate changing before the dawn of man as well, aren't we... :roll:0 -
RM291946 wrote:re-read it..obviously you missed every portion where it says humans cannot be responsible for the changes. They clearly show the sun is responsible for it.
I really hate cherry pickers...you do realise how idiotic you come off to anyone who actually bothers to read it, don't you?
I've said before climate change is real. It's been real since the day the earth began to spin. Oh but I suppose we are somehow resposible for all the climate changing before the dawn of man as well, aren't we... :roll:
I posted a link to the site with all these charts on them (my favorite is the solar activity\artic temperature\hydrocarbon chart) sometime early last year and was met with equally "enthusiastic" responses.
Brace yourself.If I was to smile and I held out my hand
If I opened it now would you not understand?0 -
LoL...I think I can handle it..been holding my own so far..
I don't get the one you are talking about..figure 2 right? None of the ones with that chart. My brain can't function right now, maybe I need to go back and have another look when I'm feeling better LoL..
Right now my fave is deffo the latest chart with the dramatic drop LoL priceless.0 -
But Al Gore said we are all going to die! The Manbearpig will soon devour us all!!
I love that it's now "global climate change" instead of "global warming." This is simply done to cover one's ass:
"Hey it's getting warmer! It's global warming!"
or "Hey it's getting colder! It could still be global warming!"So this life is sacrifice...
6/30/98 Minneapolis, 10/8/00 East Troy (Brrrr!), 6/16/03 St. Paul, 6/27/06 St. Paul0 -
great info, thanks for posting it. I never thought we had anything to do with "Globing Warming" or "climate change" or whatever they are calling it this year.Thats a lovely accent you have. New Jersey?
www.seanbrady.net0 -
darthvedder81 wrote:But Al Gore said we are all going to die! The Manbearpig will soon devour us all!!
I love that it's now "global climate change" instead of "global warming." This is simply done to cover one's ass:
"Hey it's getting warmer! It's global warming!"
or "Hey it's getting colder! It could still be global warming!"
Al gore has made himself a pretty penny with all his Global scare tactics. Remeber the Plant has a fever in his Mr. Rogers voice. That guy is such a fraud. This is also a billion dollar business for the Major corporations. I think in 1972 or 74 time mag had a cover forcasting the coming ice age. Hey in summer time it gets hot deal with it.0 -
rofl...you guys are too much!
 0
0 -
RM291946 wrote:LoL...I think I can handle it..been holding my own so far..
I don't get the one you are talking about..figure 2 right? None of the ones with that chart. My brain can't function right now, maybe I need to go back and have another look when I'm feeling better LoL..
Right now my fave is deffo the latest chart with the dramatic drop LoL priceless.
Figure 3.
Artic Temp on left side. Time on bottom. Hydrocarbons on right side.
Graph of hydrocarbons on the bottom. and Graph of Solar Radiation AND ARtic Temp on the Top.
That one looks pretty "conclusive" to me. The temperature is correlating with the sun, not the linear hydrocarbon ramp.If I was to smile and I held out my hand
If I opened it now would you not understand?0 -
DriftingByTheStorm wrote:RM291946 wrote:LoL...I think I can handle it..been holding my own so far..
I don't get the one you are talking about..figure 2 right? None of the ones with that chart. My brain can't function right now, maybe I need to go back and have another look when I'm feeling better LoL..
Right now my fave is deffo the latest chart with the dramatic drop LoL priceless.
Figure 3.
Artic Temp on left side. Time on bottom. Hydrocarbons on right side.
Graph of hydrocarbons on the bottom. and Graph of Solar Radiation AND ARtic Temp on the Top.
That one looks pretty "conclusive" to me. The temperature is correlating with the sun, not the linear hydrocarbon ramp.
ah yea..no I got that one...it's figure 2 that confused me-
http://www.oism.org/pproject/Slides/Presentation/Slide2.png0 -
Scientists question Global Warming for Temperature Drop
The temperatures worldwide are expected to drop this year because of the La Nina current in the Pacific Ocean. This has prompted some scientists to question the existence of global warming.
Weather experts say that La Nina current will last into the summer – meaning world temperatures will not have risen since 1998. A small group of scientists argue that since the temperature of earth has not risen since 1998 it means that the world has grown resilient to the greenhouse gases contrary to what was predicted.
But the World Meteorological Organisation (WMO) said the decade from 1998 to 2007 was the warmest on record and forecast a new record high temperature within five years.
Over the last century the world’s average surface temperature has risen by 0.74C.
Michel Jarraud, secretary general of the WMO, said: “When you look at climate change you should not look at any particular year.
“You should look at trends over a pretty long period and the trend of temperature globally is still very much indicative of warming.
“La Nina is part of what we call ‘variability’. There has always been and there will always be cooler and warmer years, but what is important for climate change is that the trend is up; the climate on average is warming even if there is a temporary cooling because of La Nina.”
Scientist Adam Scaife, of the Hadley Centre in Exeter, says, “What’s happened now is that La Nina has come along and depressed temperatures slightly but these changes are very small compared to the long-term climate change signal, and in a few years time we are confident that the current record temperature of 1998 will be beaten when the La Nina has ended.”0 -
Global sea temperature drop 'was artificial'
Scientists have found the reason for a sharp cooling in observed global sea temperatures at the end of the Second World War which had previously mystified students of climate change.
By using a new technique to remove temporary fluctuations they identified a number of sudden drops in global temperature, most of which coincided with major volcanic eruptions.
But the largest drop, occurring towards the end of 1945, was unrelated to any known eruption. Unlike the others, it was only apparent over the sea.
Researchers have now concluded that this drop is largely artificial.
It arises from the different methods used to measure sea-surface temperature on ships by the United States and Britain.
During the later part of the war, most of the available observations are from US ships, according to the joint study by scientists from Colorado State University, Washington University, the Met Office Hadley Centre and the Climatic Research Unit at the University of East Anglia.
A sudden increase in the frequency of observations from British ships in 1945 caused the apparent temperature drop. The initial drop is large, but it is temporary, according to the paper published in the journal Nature this week.
Scientists looked into the possible reason for the differences and found that British ships were measuring water temperature in special buckets, hauled up over the side, while the US ships were measuring temperature as the water was drawn in to cool the engines. The British method meant the water was cooled slightly by the wind before the temperature was measured.
The "drop" in global temperature caused by the differences in methods of recording added up to an apparent global average temperature difference of 0.3ºC.
By the 1960s the observing fleet was more varied and the differences between methods - which need to be corrected in climate models - are smaller.
David Thompson of Colorado State University, one of the authors, said: "I was surprised to see the drop so clearly in the filtered data, and working in partnership with others realised that it couldn't be natural."
Phil Jones of the Climatic Research Unit at the University of East Anglia said: "The study highlights how climate records need to be pieced together from measurements that were not designed to measure long-term trends and that the corrections required are an ongoing effort. It is just as vital to know how the measurements were taken as the values themselves."
John Kennedy of the Met Office's Hadley Centre said the latest finding would spur new research looking at automated ocean buoys which were also likely to have discrepancies.
The researchers say that the research gives further confirmation of the upwards trend in global temperatures over the past 150 years but the curve of variations has been smoothed out.0 -
The first post was about el nina for this year? I can't read thru your propoganda crap..
In anycase, it was worthless to post as the data I posted showing the dramatic drop was from Jan2007-Jan2008. Not this year. :roll:
Tho temps do continue to drop.
The second post was about data from ages ago. It has nothing to do with now. Another pointless post in a desperate failed attempt to "prove" the alarmist propoganda you are so fond of.0 -
RM291946 wrote:The first post was about el nina for this year? I can't read thru your propoganda crap..
In anycase, it was worthless to post as the data I posted showing the dramatic drop was from Jan2007-Jan2008. Not this year. :roll:
Tho temps do continue to drop.
The second post was about data from ages ago. It has nothing to do with now. Another pointless post in a desperate failed attempt to "prove" the alarmist propoganda you are so fond of.
You can call it propaganda all you want. The graph you posted shows a major spike in temperatures around Jan 07 and then the temperatures fall (remaining above average) till after half way through the year. Then there is a major drop till Jan 08. This drop is referred to as "For all four sources, it's the single fastest temperature change ever recorded, either up or down." <---- Yes cause that sounds very normal in itself.
The article is saying wait till this phase is gone and temperatures are recorded for the year 2009 and if its still at the levels of 2008 then fine I will say I'm wrong but they are expecting a dramatic rise once again after El nina is gone.
As for the second article, obviously you did not understand it. After the recalculation of the old data to include the wrong measuring techniques during 1945.. "the curve of variations has been smoothed out" meaning your curves have been fixed.0 -
The article says nowt about 2007-Jan 2008, it's talking about this year.
Major spike my ass. Jan.2007 started near the top of that spike.
Which curves..I posted 8 graphs. Regardless, neither side accounts for corrupted data in the 90's, and none of what you posted changes how drastic the temp drop was between 2007-2008.0 -
RM291946 wrote:The article says nowt about 2007-Jan 2008, it's talking about this year.
Major spike my ass. Jan.2007 started near the top of that spike.
Go look at your own graph again.RM291946 wrote:Which curves..I posted 8 graphs. Regardless, neither side accounts for corrupted data in the 90's, and none of what you posted changes how drastic the temp drop was between 2007-2008.
Wrong. The Nature article I posted in the other thread accounts for this in their model. As I stated before and I will state again scientists have given you a reason for that drop, not to mention your own article's words saying "its the biggest temperature change they've ever recorded".0 -
I know what the graph shows. I said Jan2007 started near the top of that peak.
That Nature article is crap. That nature article shows a possibility from a made up scenario. You are relying heavily on something that is not worth the time of day, and you and your fellow alarmist buddy on here are the only 2 who buy into it. Everyone else is showing they don't buy the bullshit.0 -
you're choosing to ignore the signs right in front of you.RM291946 wrote:I know what the graph shows. I said Jan2007 started near the top of that peak.
That Nature article is crap. That nature article shows a possibility from a made up scenario. You are relying heavily on something that is not worth the time of day, and you and your fellow alarmist buddy on here are the only 2 who buy into it. Everyone else is showing they don't buy your bullshit.0 -
no doll..I'm not the one doing that. I fully acknowledge the cool that is making my hands so cold it's difficult to type.0
-
*Puts decent lightbulbs back in their sockets; stops going blind*0


Categories
- All Categories
- 149.2K Pearl Jam's Music and Activism
- 110.3K The Porch
- 287 Vitalogy
- 35.1K Given To Fly (live)
- 3.5K Words and Music...Communication
- 39.4K Flea Market
- 39.4K Lost Dogs
- 58.7K Not Pearl Jam's Music
- 10.6K Musicians and Gearheads
- 29.1K Other Music
- 17.8K Poetry, Prose, Music & Art
- 1.1K The Art Wall
- 56.8K Non-Pearl Jam Discussion
- 22.2K A Moving Train
- 31.7K All Encompassing Trip
- 2.9K Technical Stuff and Help